2026 Hospitality Benchmark Report
The hospitality benchmark report with superpowers—built from real hotel data
Our annual Hospitality Benchmark Report has been the industry’s secret weapon for 11 years now. Hoteliers use this data-driven arsenal to benchmark performance, identify revenue opportunities, and dominate their competitive landscape with strategies powered by actual industry data, not surveys or speculation.
This hospitality benchmark report analyzes every critical dimension: guest communication, database quality, engagement rates, review response, revenue per contact, and ratings by property size and class. Whether you’re comparing email monetization, defending your ratings against competitors, or optimizing automation, you’ll unlock the intelligence to set targets, justify investments, and capture revenue growth.

Unleash guest engagement strategies powered by real intelligence from 2.8 billion.
Benchmark your call center performance against real data from 4.3 million guest calls across the industry.
Deploy AI-powered texting to save your staff time and personalize your guest experiences.
Unlock what drives guest satisfaction, loyalty, and repeat bookings from 28 million reviews across the industry.
Available data
& how to navigate the benchmark report
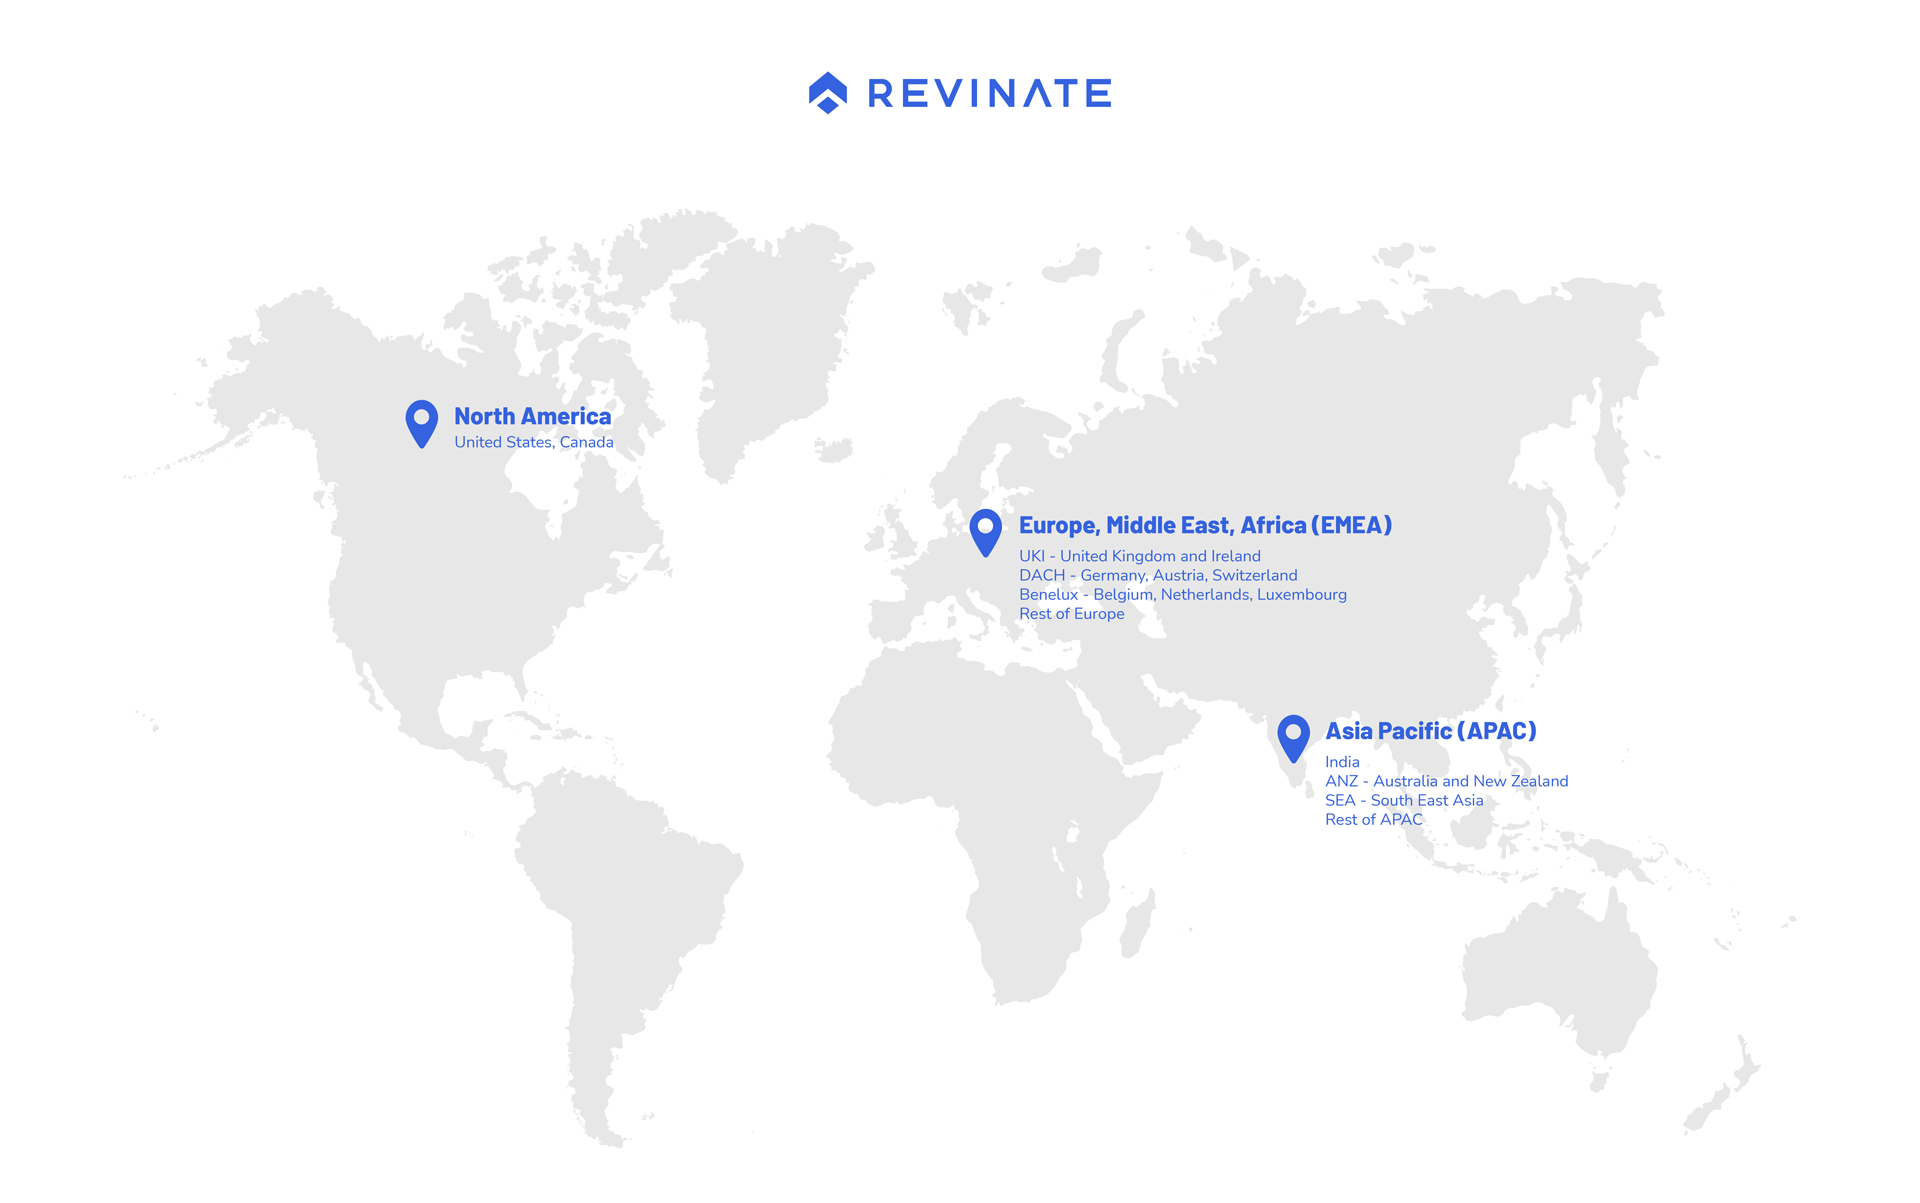
This report is organized into five sections that represent your hospitality marketing efforts: the foundation of database health, and the channels where you collect and activate guest data — email, voice, messaging, and web capture. Additionally, each section has a version tailored to your region (North America, APAC, EMEA, Global) with detailed breakdowns of local markets, along with benchmarks for various hotel classes and sizes.
Discover how hoteliers are leveraging the email channel to drive ancillary revenue and manage their reputation.
Discover how hoteliers are using the voice channel to increase their call center conversion rates.
Learn how AI-powered guest messaging decreases staff workloads and resolves guest requests faster than staff.
Learn how top-performing hotels leverage guest feedback for reputation management and cart abandonment.


Methodology
Data definitions and how to navigate the benchmark report
This report contains data collected from Revinate hotel software products (Revinate Marketing, Revinate Guest Feedback, Revinate Ivy, and Revinate Reservation Sales) from January 1, 2025 through December 31, 2025.
To create this report, we analyzed 2.8 billion emails, 28 million guest reviews, 22 million text messages, and 4.3 million calls from hoteliers located in North America, APAC, and EMEA. Data from Revinate Ivy and Reservation Sales are limited to North America.
Find more information below on how we defined the statistics and calculated the data in this report. We’ve also included definitions for acronyms and information on regional segmentation. One important call out, as with every hospitality benchmark report we publish, we take into account numbers on a same-store-sales concept. This will invariably mean variances from previously reported numbers for 2024. Drop us a line if you’d like to understand this better or if you have questions: media(AT)revinate.com
| Term | Definition |
|---|---|
| ANZ region | Data includes hotels located in Australia and New Zealand. |
| APAC region | Asia-Pacific. Data includes hotels in all APAC micro-regions combined. |
| Automation rate | The count of messages resolved by Ivy divided by the total number of messages resolved by Ivy or staff combined. |
| Average booking value | The total $USD value of reservations divided by the total number of reservations. This represents the average value of an individual booking from a given segment. |
| Benelux region | Data includes hotels located in Belgium, Luxembourg, and the Netherlands. |
| Call volume | The average number of inbound phones a hotel receives per month. |
| Click through rate | The number of emails where a hyperlink was clicked divided by the number of sent emails. |
| Conversion rate | The number of completed bookings divided by the number of sent emails. |
| DACH region | Data includes hotels located in Austria, Germany, Liechtenstein, and Switzerland. |
| Database growth | We identified the total number of database records of profiles in each regional segment in 2025 and the number of database records those same customers had in 2024, and calculated the percent change. This method is called same-store sales, and it represents the average growth of a hotelier’s database in that time period. (The number of database records of hoteliers in 2025 minus the number of database records of those same hoteliers in 2024) divided by the number of database records of the same hoteliers in 2024. |
| Database records with an OTA-masked email address | The number of raw profiles with a known OTA-masked email address divided by the total number of raw profiles. |
| Database records with phone numbers | The number of records in a database with a phone number divided by the total number of records. |
| Database records with valid email addresses | The number of records in a database with a valid email address divided by the total number of records. A valid email address is defined as one not masked by an OTA. |
| Email capture rate | Total number of non-booked lead calls where emails were obtained in the process divided by the number of total non-booked lead calls. |
| EMEA region | Europe, the Middle East, and Africa. Data includes hotels in all EMEA micro-regions combined. |
| Global region | Data from North America, EMEA, and APAC combined |
| Hotel class | Hotel classes are defined using the Smith Travel Research (STR) system, including Luxury, Upper Upscale, Upscale, Upper Midscale, Midscale, and Economy. |
| Hotel rating | The score a hotel receives on a scale of 1-5 on public review sites. |
| Hotel review volume | The average number of new public reviews a hotel receives each month. |
| Incoming message volume | Average number of messages that guests send to Ivy per month. |
| Incoming messages | Messages that guests send to Ivy. |
| Incremental revenue per room from outbound calls | The additional revenue a hotelier earns per room based on the outbound conversion rate of non-booked leads multiplied by the average booking value of a reservation made on the voice channel. |
| Lead call conversion rate | Total number of booked inbound lead calls divided by the total number of inbound lead calls. |
| Lead call volume | The average number of phone calls received from leads that a hotel receives per month. Lead calls are calls inquiring about reservations as opposed to other inquiries. |
| MEA region | Data includes hotels located in the Middle East and Africa. |
| Median resolution time | The median is the midpoint in the range of times it takes for a guest message to be considered “resolved” – i.e. no further action is needed. Ivy’s resolution time is based on her ability to auto-resolve guest messages, while staff resolution time is based on their time to manually address and resolve messages. We are presenting the median because it excludes extreme outliers — for example, when a hotelier has addressed a guest's concern but forgets to mark it as resolved. |
| Merged profiles per database | This is the merge rate - the number of merged profiles divided by the number of raw profiles in a customer database. With the Revinate product roadmap development, in 2027, we will be replacing this metric with merge rate & rich guest profile count instead. |
| Messaging engagement rate | The number of times a guest responds to Ivy’s first message divided by the total number of first messages from Ivy each month summed across all months in 2025 divided by 12. |
| Messaging opt-out rate | The percent of guests who decline to receive further messages from Ivy. |
| NAM region | North America. Data includes hotels located in Canada, the Caribbean, Central America, Mexico, and the United States. |
| Net Promoter Score | Net Promoter Score (NPS) measures customer loyalty through a single question about recommendation likelihood on a 0-10 scale. It's calculated by subtracting the percentage of Detractors (scores 0-6) from the percentage of Promoters (scores 9-10), with both percentages based on the total number of respondents. This results in a score ranging from -100 to 100 that indicates overall customer satisfaction and loyalty. |
| Non-booked lead volume | Average total number of lead calls that do not result in a reservation. |
| One-time campaigns | Campaigns where all emails are sent to recipients at the same time. |
| Open rate | The number of emails opened divided by the number of sent emails. |
| Outbound conversion rate of non-booked leads | The number of booked outbound calls without any associated inbound call within 30 days prior to the booking divided by the total number of non-booked leads. |
| Outgoing messages | Messages that Ivy sends to a guest. Includes both automated messages and those written by staff. |
| Recurring campaigns | Campaigns where emails are sent to recipients at different times automatically based on certain events or triggers, such as checking in, a guest’s birthday, or canceling a booking. |
| Rest of APAC region | Data includes hotels located in Bangladesh, Bhutan, China, Cook Islands, Fiji, French Polynesia, Guam, Hong Kong, Japan, Republic of Korea, Macao, Maldives, Mongolia, Nepal, New Caledonia, Northern Mariana Islands, Pakistan, Papua New Guinea, Samoa, Solomon Islands, South Korea, Sri Lanka, Taiwan, Tonga, Vanuatu, Palau. |
| Rest of Europe region | Data includes hotels located in Albania, Andorra, Armenia, Belarus, Bosnia and Herzegovina, Bulgaria, Croatia, Cyprus, Czech Republic, Estonia, Finland, France, Georgia, Gibraltar, Greece, Guernsey, Hungary, Iceland, Italy, Latvia, Lithuania, Macedonia, Malta, Moldova, Monaco, Montenegro, Poland, Portugal, Romania, Russia, San Marino, Serbia, Slovakia, Slovenia, Spain, Turkey, and Ukraine. |
| Revenue per segment filter | The total average of (revenue of a segmented campaign divided by the number of emails sent). |
| Review response rate | The average number of new reviews a hotelier publicly responds to. |
| Room nights per booking (recurring campaigns) | The average number of room nights in an individual reservation from a recurring campaign within a segment. |
| Room nights per campaign (one-time campaigns) | The total number of room nights reserved as a result of one-time campaigns averaged across all one-time campaigns by segment within the year. |
| Scandinavia region | Data includes hotels located in Denmark, Norway, and Sweden. |
| SEA region | South East Asia. Data includes hotels located in Brunei, Cambodia, Indonesia, Laos, Malaysia, Myanmar, Philippines, Singapore, Thailand, Vietnam. |
| South Asia region | Data includes hotels located in India, Sri Lanka and Maldives |
| Send size | The number of emails sent in a campaign. |
| Survey response rate | The number of surveys submitted by guests divided by number of surveys sent to guests. |
| UKI region | Data includes hotels located in the United Kingdom and Ireland. |
| Upsell categorization | A statistically significant random sample of upsells were labeled to determine the population proportion of categories with 99% confidence and a bound of error of 5%. |
| Upsell revenue | The average revenue per upsell within a segment, i.e. the total upsell revenue divided by the number of upsell campaign emails sent within a segment. |
| Upsell utilization | Number of customer accounts who have deployed an upsell campaign divided by the total number of customer accounts within the segment. Only applies to customers with subscription in both 2024 and 2025 for accurate year-over-year comparison. |
| Value (in USD) of database records with phone numbers | Incremental value is determined by the difference between the average revenue of all bookings with a phone number compared to the average revenue of the remaining bookings without said information. |
| Value (in USD) of database records with valid email addresses | Incremental value is determined by the difference between the average revenue of all bookings with a valid email address compared to the average revenue of the remaining bookings without said information. A valid email address is defined as one not masked by an OTA. |